One of the most common questions from first-time Trades is: what is the perfect trading indicator?
The perfect trading indicator, unfortunately, doesn’t exist. Each trader’s preferences, the time frame, and the market conditions have a direct impact on the choice of the best indicator to employ in a trading strategy.
When it comes to selecting trading indicators, I like to make things simple. Fancy and advanced trading indicators can give you high accuracy in specific conditions. On the other hand, they need experience and extensive backtesting of historical results before being used for live trading. They are not advisable to those that can’t adequately manage the complex and mixed results which these indicators often provide.
From among the most used indicators, the Relative Strength Index (RSI) is a very flexible option and often offers accurate signals, especially on longer-term time frames. The trader can set it up and interpret it very quickly.
What is RSI?
As the name suggests, the RSI gauges the strength of the price trend within a given number of periods, generally 14. In that case, the overall time taken into account would be of 14 days on the daily chart, 14 hours on the hourly, 7 hours on the 30-minutes chart, and so on… Here is the formula:
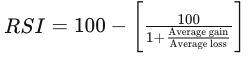
The formula takes into account the percentage of price moves up compared to those down. The general idea is that the faster the price is moving upward, the more likely is a retrace downward.
The RSI is very straightforward to use since the value of the indicator can only range between 0 to 100, the trader can identify easily overbought and oversold price conditions.
How to interpret the values?
Generally, values below 30 indicate that the price suffered extreme pressure in the recent past and will probably experience a “relief rally” soon. On the other hand, values above 70 signal a level of overbuying that could quickly revert.
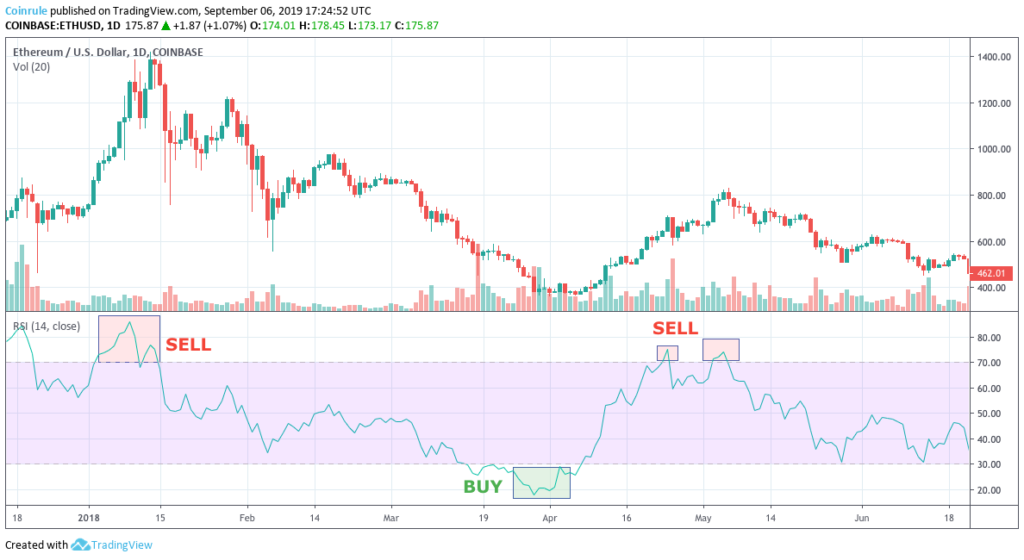
As easy as it seems, trading just based on these simple signals can be useful but only under one condition. The market must move mostly lateral with no clear trend. In this way, the RSI would be used as a contrarian indicator, indicating the probability that the price is changing direction. The trader would then sell the asset when the RSI is above 70 and buy it when the value drops below 30.
What about when the price is trending strongly? In this case, the RSI loses its accuracy significantly and, for example, can signal to sell, while there is still room for price upside.
How to get the best out of RSI?
Catching overbought and oversold price conditions is only the most simple use-case for the indicator. The RSI provides much more information about the price trend, and this information can be significant in any market condition.
Looking only at the value of the RSI is a limited approach. A dynamic analysis provides a different way to look at the trend, this time from the point of view of its strength.
Imagine launching a ball in the air. At first, the ball accelerates fast for the initial push. But then, as the initial force fades, the speed of the ball slowly decreases until the gravity becomes stronger and the ball reverts to the ground. This very clear example can also be applied to asset prices. And RSI is the perfect indicator that can measure the current acceleration of the price to predict the probabilities of a reversal.
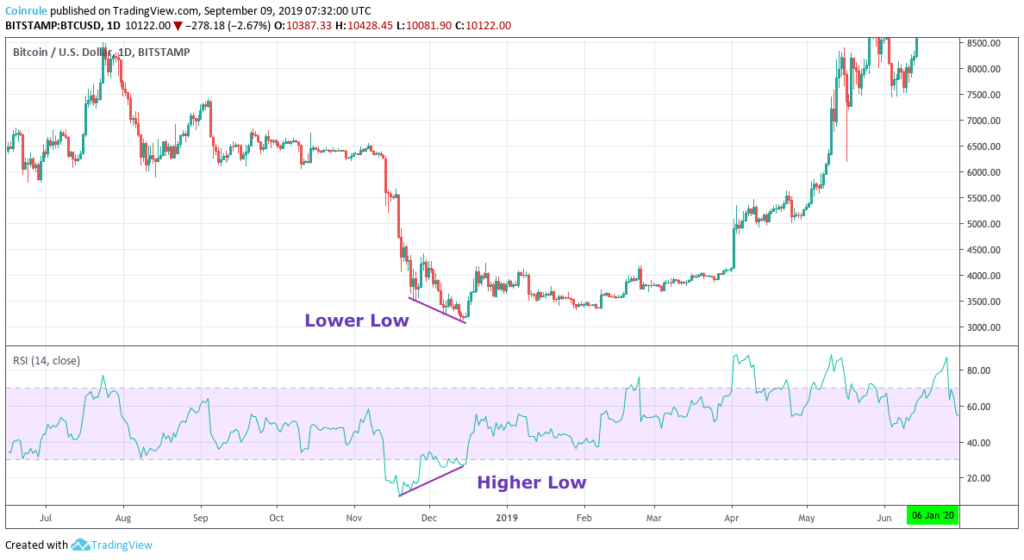
Looking at how the RSI evolves over time together with the price chart, it is possible to spot eventual divergences between the indicator and the price. These divergences are among the most accurate signals that the price is going to revert soon.
How to spot divergences?
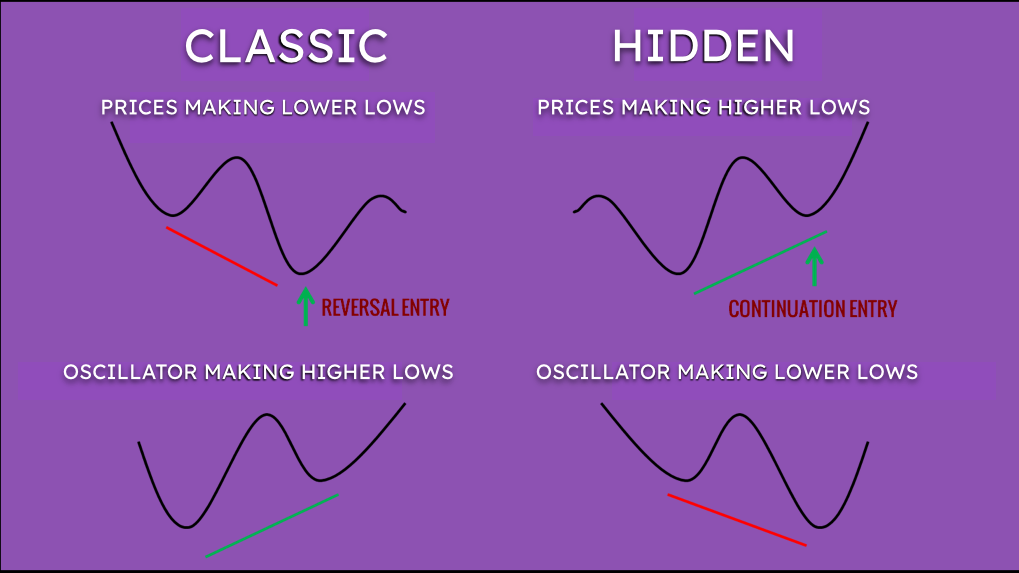
We can divide divergences into two groups, the Classic and the Hidden.
A classic bull divergence happens when the price makes a lower low, and at the same time, the indicator is posting a higher low. This pattern is usually a sound indication that the downtrend is weakening and there are good chances of a reversal. On the other hand, a price’s higher high together with an RSI’s lower high indicates that the trend is weakening and that could represent an opportunity for selling.
A hidden bullish divergence on the other hand happens when the price forms a higher low, while the RSI makes a lower low. Here is a visual recap of the main Bullish divergences, usually they represent very interesting buying opportunities.
Main conclusions
- Always keep an eye on the RSI in parallel with the price chart, it often adds elements for the analysis
- The longer the time frame, the more useful the RSI becomes
- Trade according to the rule of 30 – 70 but only if the market is generally not very volatile
- During uptrends and downtrends look for price divergences with the RSI to get a clue about the momentum of the price
- Never trade only according to the RSI, use this indicator as a confirmation before entering a trade.